
- (+43) 664 2081526
- info@mahevi.solutions
mahevi | Costing and planning application
Description
- Reference rate calculation for determining reference rates in batch runs
- Product costing for determining contribution margins in present values and margin equivalents
- In memory calculation
- Output in Excel, PDF or dispatch via e-mail or provision via API.
- Planning and scenario tool for calculating P&L, liquidity and stress testing
Profile
- Host: private
- Stack: VB, .net, mvc
- Url: private
- Datum: 2010
Features
Reference rate calculation
Determination of reference records in batch runs.
Product costing
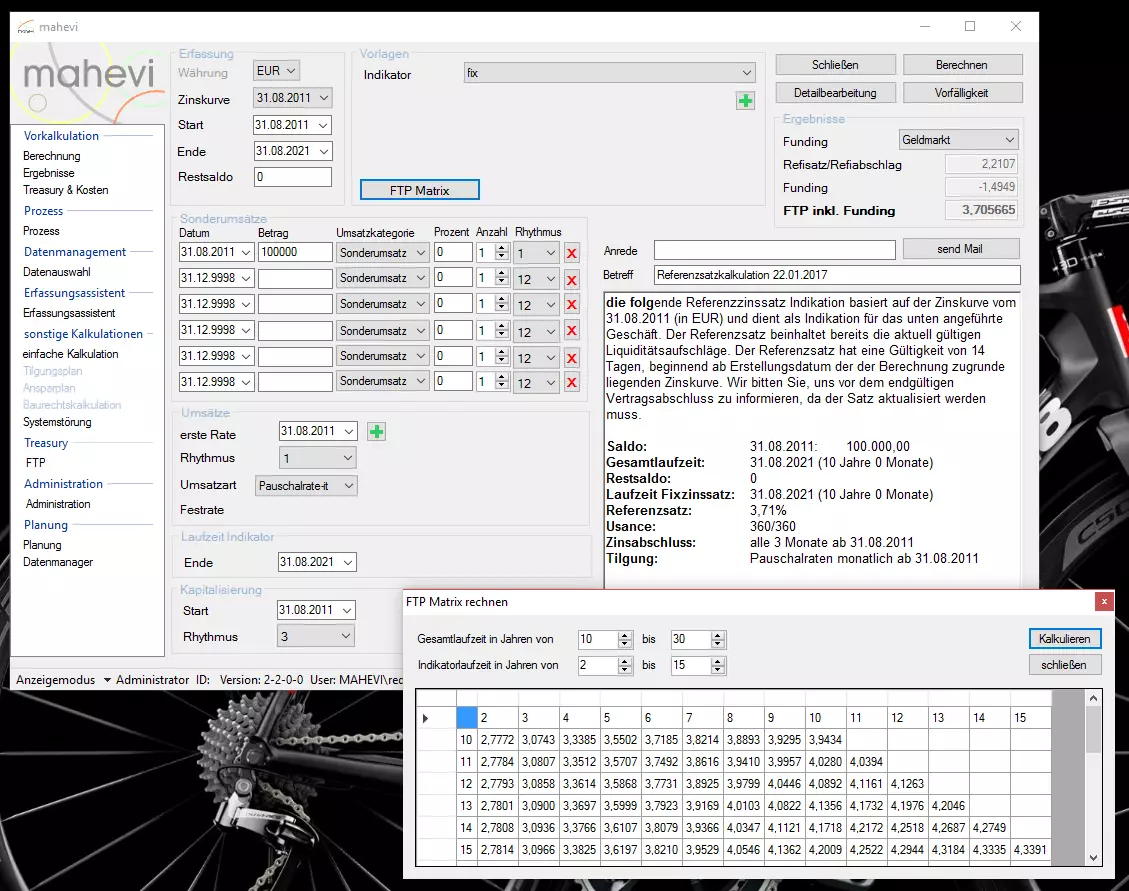
As part of a standardized product costing, all pricing-relevant parameters can be calculated decentrally by the customer service representative. In addition to staggered indicators, these include individual cash flow structures, capitalizations, interest rate ratios, fees, commissions, product-specific costs and risk-relevant information. In this way, a complete contribution margin calculation according to margins or present values can be carried out in a decentralised and targeted manner.
- Special sales
- Indicator
- Capitalization
- Costs, commissions and fees
- Funding costs
- Risk costs
- Cost of Capital
In Memory
In order to increase performance, the database was separated from the calculation core. Due to the fact that the calculation does not require database access, the computing power is massively accelerated. In the process flow, all relevant parameters (liquidity costs, base costs, volatilities, current and historical yield curves) are synchronized in memory when the application is started. After the calculation, only the results (cash flows, margins, present values, etc.) are written back to the database.
Output
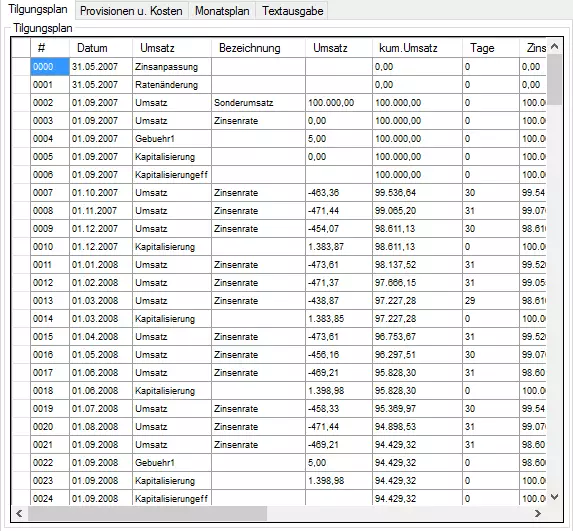
Repayment plans can be issued as part of the preliminary costing. These can also be processed in Excel or as PDF, or via an interface in other applications.
Text output
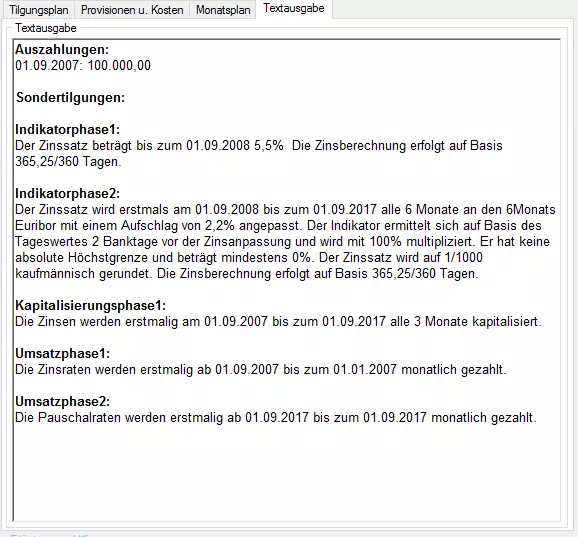
The entered parameters are translated into continuous text. This not only allows for better detection control. The text can also be transferred directly to a customer offer via an interface.
Planning and scenario tool
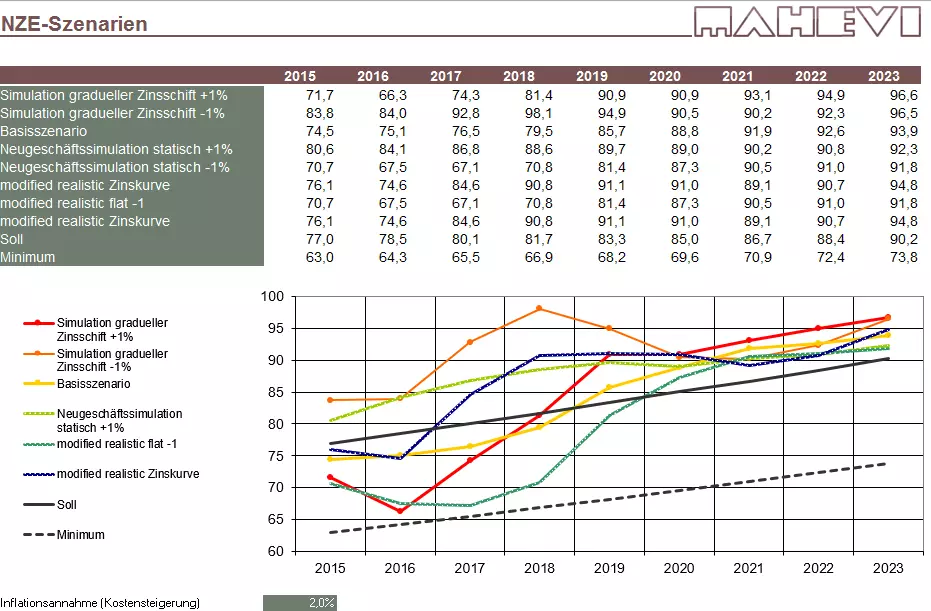
The planning and scenario tool enables the simulation of expected cash flows, interest results, present value development (including fair value), capital requirements (standard approach and IRB), risk costs, impairment requirements, etc. over time.
Once you have collected your data, a multi-year planning or simulation can be carried out. The tool already takes into account a future-oriented present value and FV engine, which will become increasingly important in the context of IFRS 9 implementation. The biggest challenge, however, is to structure the data accordingly and to define all relevant parameters correctly.
- Net interest income simulation
- Liquidity management
- Present value and cost control
- Simulation parameters and results
The simulation result is influenced in particular by customer behaviour, risk parameters (rating, PD, LGD), collateral development, interest rate level and market data (volatility, funding costs, own rating, etc.). As a result, depending on the scenario, the interest result, liquidity balance sheet, future-oriented fair value and present value, risk capital requirements and risk costs are obtained.
Details
Reference rate calculation
The first version determined reference prices for different fixed interest rates separately from the CashFlow profiles and capitalizations in a batch run. It has already taken into account caps/floors, effective interest rates, liquidity costs, structuring costs (bid/ask) and contribution margins according to margin equivalents and present values. According to current understanding, the effective interest rate method, epsilon calibration and FV calculation had already been implemented. However, performance was a particular challenge, as on the one hand indicators (secondary market returns), special repayment forms (lump sums) and on the other hand payment behaviour (prepayments) placed high demands on the computing capacity.
Product costing
As part of a standardized product costing, all pricing-relevant parameters can be calculated decentrally by the customer service representative. In addition to staggered indicators, these include individual cash flow structures, capitalizations, interest rate ratios, fees, commissions, product-specific costs and risk-relevant information. In this way, a complete contribution margin calculation according to margins or present values can be carried out in a decentralised and targeted manner.
Special transactions Payouts
, premiums, fees etc. are entered individually. Thus, in addition to a one-time payment, expected cash flows can be defined according to a payout plan (e.g. construction progress) and product-specific costs can be included (lawyer's fees, etc.).
Indicator
Any indicator can be recorded (SMR, CMS, EURIBOR, etc.). In addition to the custom, a time lag, averaging, different adjustment rhythms, caps, floors, etc. must also be recorded. This information is particularly necessary for the benchmark test in accordance with IFRS 9.
Indicators and fixed interest rates can be lined up as desired. This option is particularly interesting for step interest recording.
Capitalization
Interest capitalizations can be recorded separately from interest rate adjustments. In this way, interest rates or the development of the clean and dirty price can be presented in a structured manner and are taken into account in the fair value, present value and effective interest rate.
Costs, commissions and fees
Costs, payable commissions and fees charged have a significant impact on the profitability of a business. Not only one-off product costs and indirect distribution costs such as brokerage commissions are calculated, but also indirect target structure costs.
Funding costs
Depending on the funding source, coverage pool capability, customer segment, product category, the expected funding costs are determined. However, simplified procedures are also possible. Some banks use the duration to calculate simplified funding matrices, which can be entered in the calculation. Interesting is the possibility of calculating the liquidity option as part of the offer process and the possibility of repayments/renegotiations.
Risk costs
The risk costs are mainly determined on the basis of the customer rating, customer segment and collateral development. Simplified procedures (fixed risk costs on the portfolio) but also more complex procedures (cash flow modification) can be parameterized taking into account LGD and PD development.
Cost of Capital
Cost of Capital can be determined on the one hand on the basis of the Basel III / IRB approach or simplified according to expected product and segment contributions.In
memory
In order to increase performance, the database was separated from the calculation core. Due to the fact that the calculation does not require database access, the computing power is massively accelerated. In the process flow, all relevant parameters (liquidity costs, base costs, volatilities, current and historical yield curves) are synchronized in memory when the application is started. After the calculation, only the results (cash flows, margins, present values, etc.) are written back to the database.
Output
Repayment plans can be issued as part of the preliminary costing. These can also be processed in Excel or as PDF, or via an interface in other applications.
Text output
The entered parameters are translated into continuous text. This not only allows for better detection control. The text can also be transferred directly to a customer offer via an interface.
Planning and scenario tool
The planning and scenario tool enables the simulation of expected cash flows, interest results, present value development (including fair value), capital requirements (standard approach and IRB), risk costs, impairment requirements, etc. over time.
Once you have collected your data, a multi-year planning or simulation can be carried out. The tool already takes into account a future-oriented present value and FV engine, which will become increasingly important in the context of IFRS 9 implementation. The biggest challenge, however, is to structure the data accordingly and to define all relevant parameters correctly.
Net interest income simulation
Until 2007, the main focus was on net interest income simulation. This also included interest rate management during the year, when complex indicators do not balance each other out over the year. Deterministic stress and new business assumptions make it quite easy to simulate the interest result. Until 2007, customer behavior was of great importance for the customer at that time, which, depending on the product, was strongly dependent on the interest rate cycle.
Liquidity management
A liquidity gap simulation makes it easy to display the funding requirements with different stress assumptions. In addition, the repricing risk is of particular importance.
Present value and cost control
The possibilities of fair value and present value simulation, capital requirements simulation and risk cost simulation become relevant with IFRS 9 and have already been implemented in the tool.
Simulation parameters and results
The simulation result is influenced in particular by customer behaviour, risk parameters (rating, PD, LGD), collateral development, interest rate level and market data (volatility, funding costs, own rating, etc.). As a result, depending on the scenario, the interest result, liquidity balance sheet, future-oriented fair value and present value, risk capital requirements and risk costs are obtained.

Features
Reference rate calculation
Determination of reference records in batch runs.
Product costing
As part of a standardized product costing, all pricing-relevant parameters can be calculated decentrally by the customer service representative. In addition to staggered indicators, these include individual cash flow structures, capitalizations, interest rate ratios, fees, commissions, product-specific costs and risk-relevant information. In this way, a complete contribution margin calculation according to margins or present values can be carried out in a decentralised and targeted manner.
- Special sales
- Indicator
- Capitalization
- Costs, commissions and fees
- Funding costs
- Risk costs
- Cost of Capital
In Memory
In order to increase performance, the database was separated from the calculation core. Due to the fact that the calculation does not require database access, the computing power is massively accelerated. In the process flow, all relevant parameters (liquidity costs, base costs, volatilities, current and historical yield curves) are synchronized in memory when the application is started. After the calculation, only the results (cash flows, margins, present values, etc.) are written back to the database.
Output
Repayment plans can be issued as part of the preliminary costing. These can also be processed in Excel or as PDF, or via an interface in other applications.
Text output
The entered parameters are translated into continuous text. This not only allows for better detection control. The text can also be transferred directly to a customer offer via an interface.
Planning and scenario tool
The planning and scenario tool enables the simulation of expected cash flows, interest results, present value development (including fair value), capital requirements (standard approach and IRB), risk costs, impairment requirements, etc. over time.
Once you have collected your data, a multi-year planning or simulation can be carried out. The tool already takes into account a future-oriented present value and FV engine, which will become increasingly important in the context of IFRS 9 implementation. The biggest challenge, however, is to structure the data accordingly and to define all relevant parameters correctly.
- Net interest income simulation
- Liquidity management
- Present value and cost control
- Simulation parameters and results
The simulation result is influenced in particular by customer behaviour, risk parameters (rating, PD, LGD), collateral development, interest rate level and market data (volatility, funding costs, own rating, etc.). As a result, depending on the scenario, the interest result, liquidity balance sheet, future-oriented fair value and present value, risk capital requirements and risk costs are obtained.
Details
Reference rate calculation
The first version determined reference prices for different fixed interest rates separately from the CashFlow profiles and capitalizations in a batch run. It has already taken into account caps/floors, effective interest rates, liquidity costs, structuring costs (bid/ask) and contribution margins according to margin equivalents and present values. According to current understanding, the effective interest rate method, epsilon calibration and FV calculation had already been implemented. However, performance was a particular challenge, as on the one hand indicators (secondary market returns), special repayment forms (lump sums) and on the other hand payment behaviour (prepayments) placed high demands on the computing capacity.
Product costing
As part of a standardized product costing, all pricing-relevant parameters can be calculated decentrally by the customer service representative. In addition to staggered indicators, these include individual cash flow structures, capitalizations, interest rate ratios, fees, commissions, product-specific costs and risk-relevant information. In this way, a complete contribution margin calculation according to margins or present values can be carried out in a decentralised and targeted manner.
Special transactions Payouts
, premiums, fees etc. are entered individually. Thus, in addition to a one-time payment, expected cash flows can be defined according to a payout plan (e.g. construction progress) and product-specific costs can be included (lawyer's fees, etc.).
Indicator
Any indicator can be recorded (SMR, CMS, EURIBOR, etc.). In addition to the custom, a time lag, averaging, different adjustment rhythms, caps, floors, etc. must also be recorded. This information is particularly necessary for the benchmark test in accordance with IFRS 9.
Indicators and fixed interest rates can be lined up as desired. This option is particularly interesting for step interest recording.
Capitalization
Interest capitalizations can be recorded separately from interest rate adjustments. In this way, interest rates or the development of the clean and dirty price can be presented in a structured manner and are taken into account in the fair value, present value and effective interest rate.
Costs, commissions and fees
Costs, payable commissions and fees charged have a significant impact on the profitability of a business. Not only one-off product costs and indirect distribution costs such as brokerage commissions are calculated, but also indirect target structure costs.
Funding costs
Depending on the funding source, coverage pool capability, customer segment, product category, the expected funding costs are determined. However, simplified procedures are also possible. Some banks use the duration to calculate simplified funding matrices, which can be entered in the calculation. Interesting is the possibility of calculating the liquidity option as part of the offer process and the possibility of repayments/renegotiations.
Risk costs
The risk costs are mainly determined on the basis of the customer rating, customer segment and collateral development. Simplified procedures (fixed risk costs on the portfolio) but also more complex procedures (cash flow modification) can be parameterized taking into account LGD and PD development.
Cost of Capital
Cost of Capital can be determined on the one hand on the basis of the Basel III / IRB approach or simplified according to expected product and segment contributions.In
memory
In order to increase performance, the database was separated from the calculation core. Due to the fact that the calculation does not require database access, the computing power is massively accelerated. In the process flow, all relevant parameters (liquidity costs, base costs, volatilities, current and historical yield curves) are synchronized in memory when the application is started. After the calculation, only the results (cash flows, margins, present values, etc.) are written back to the database.
Output
Repayment plans can be issued as part of the preliminary costing. These can also be processed in Excel or as PDF, or via an interface in other applications.
Text output
The entered parameters are translated into continuous text. This not only allows for better detection control. The text can also be transferred directly to a customer offer via an interface.
Planning and scenario tool
The planning and scenario tool enables the simulation of expected cash flows, interest results, present value development (including fair value), capital requirements (standard approach and IRB), risk costs, impairment requirements, etc. over time.
Once you have collected your data, a multi-year planning or simulation can be carried out. The tool already takes into account a future-oriented present value and FV engine, which will become increasingly important in the context of IFRS 9 implementation. The biggest challenge, however, is to structure the data accordingly and to define all relevant parameters correctly.
Net interest income simulation
Until 2007, the main focus was on net interest income simulation. This also included interest rate management during the year, when complex indicators do not balance each other out over the year. Deterministic stress and new business assumptions make it quite easy to simulate the interest result. Until 2007, customer behavior was of great importance for the customer at that time, which, depending on the product, was strongly dependent on the interest rate cycle.
Liquidity management
A liquidity gap simulation makes it easy to display the funding requirements with different stress assumptions. In addition, the repricing risk is of particular importance.
Present value and cost control
The possibilities of fair value and present value simulation, capital requirements simulation and risk cost simulation become relevant with IFRS 9 and have already been implemented in the tool.
Simulation parameters and results
The simulation result is influenced in particular by customer behaviour, risk parameters (rating, PD, LGD), collateral development, interest rate level and market data (volatility, funding costs, own rating, etc.). As a result, depending on the scenario, the interest result, liquidity balance sheet, future-oriented fair value and present value, risk capital requirements and risk costs are obtained.